When I moved my WordPress blog to to an Amazon AWS instance I noticed a huge decrease in performance. Where the old (dedicated) server took a second or so to load a page, this increased to 5-10 seconds per page. It would be easy to point at the server as the bottleneck here, and to some extent that may be right, but a slow server can also highlight an existing performance problem. I soon noticed that some WordPress plugins are real performance killers. Lets dig straight in to the problems I ran into…
Find the reason for the slowdown
Slow page loading can have a lot of causes. They could be anything from things you can not influence, like slow interconnects between you and the server, up to things you can influence like the plugins that burn resources and time while executing.
Wordpress does not out of the box give you a good overview of these things, an even if the golden rule of WordPress should be “use the least amount of plugins as possible”, sometimes it is necessary to install some extras to help.
There are a number of plugins out there that help you to find the reason for your slow WordPress. I can’t go through them all here, but I will give some details of three that I found helpful.
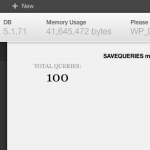
Debug Bar will show a “Debug” menu option as soon as you are logged in with some useful information about the version of PHP & MySQL you are using, as well as the memory usage stats and the amount of queries that were executed during the page load. The nice thing about it is that it shows this only when you are logged in.
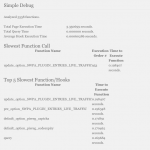
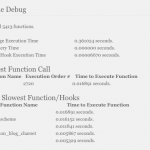
Simple Debug will also only reveal its information when you are logged in. This is handy as you can try to find the reason for your blog’s poor performance while the blog is still live. This plugin will show you statistical info at the end of the page. I noticed that the text was unreadable at the end of my page, (this I guess is because of my dark background), but by selecting all the text on the page it was readable. One noticeable point for developers is the listing of the “Top 5 Slowest Function/Hooks”.
![]() When you start debugging your WordPress installation, make sure caching plugins are switched off as they might influence your results. These false results will likely interfere with finding any real performance problems.
When you start debugging your WordPress installation, make sure caching plugins are switched off as they might influence your results. These false results will likely interfere with finding any real performance problems.
First Result
After I installed these two plugins I was shocked to see more then 100 queries for one page load shown by “Debug Bar”. “Simple Debug” revealed more details than that by showing the top 5 slowest functions. It also shows the total time needed to process the request.
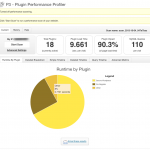
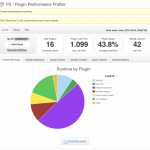
A third plugin called P3 (Plugin Performance Profiler) shows the time consumption on a per plugin basis. These results can be very helpful in finding a plugin that behaves badly. In my case, the result points quite precisely to 2 plugins.
The result of the “P3 (Plugin Performance Profiler)” shows two plugins consuming about 92% of the complete processing time, while the others combined use such a little amount that the “P3 (Plugin Performance Profiler)” groups them simply as “Others”. The two resource and time wasting plugins were Acunetix Secure WordPress and the Pie Register plugin.
A deeper look into the result from the “Simple Debug” plugin confirms the result from “P3 (Plugin Performance Profiler)”. The function names found in the top 5 slowest functions point to the same two plugins. The function names containing “SWPA_PLUGIN” belong to “Acunetix Secure WordPress”, while the function names containing “piereg” belong to “Pie Register”.
Re-run with disabled plugins
After I disabled the 2 plugins that where shown by the debugging-plugins, I executed “P3 (Plugin Performance Profiler)” again, as well as re-checking the other results. The result was amazing!
As you can see, the complete request time reduces from 9.661 to 1.099 seconds. That is a huge difference in user experience. “Simple Debug” measures slightly differently, but still shows a similar difference in the execution time from 3.3506 to 0.3610 seconds.
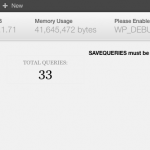
The result delivered by “Debug Menu” shows an indication where the two plugins wasted their time. The initially count of 100 SQL queries is reduced to 33 SQL queries. Even if SQL databases are considered fast, performing 67 queries takes time, and even if the many queries are not the only reason for these plugins being slow, it might give a hint.
The “Acunetix Secure WordPress” plugin claims to provide additional security for your WordPress installation, as it seems, this security comes with a price! I also tried another security plugin called WordPress Firewall which uses so little time to execute that even in the re-run it shows up under “Other”.
Compare results
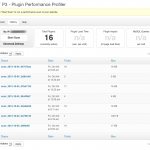
While a WordPress installation is evolving, you might want to keep track of the performance numbers. The “P3 (Plugin Performance Profiler)” plugin is perfect for this as it stores the results from your measurements. You can at any time view older results and compare them with the latest run. “Simple Debug” and “Debug Menu” do not provide this functionality as their measurements and goals are quite different.
Read more of my posts on my blog at http://blog.tinned-software.net/.

